

Control Plane & Dashboard
Everything Lifeboat does is in the browser: no CLI, no SSH to a GPU host. The Dashboard is the first place to look when something is wrong, and this page explains what each panel is telling you.
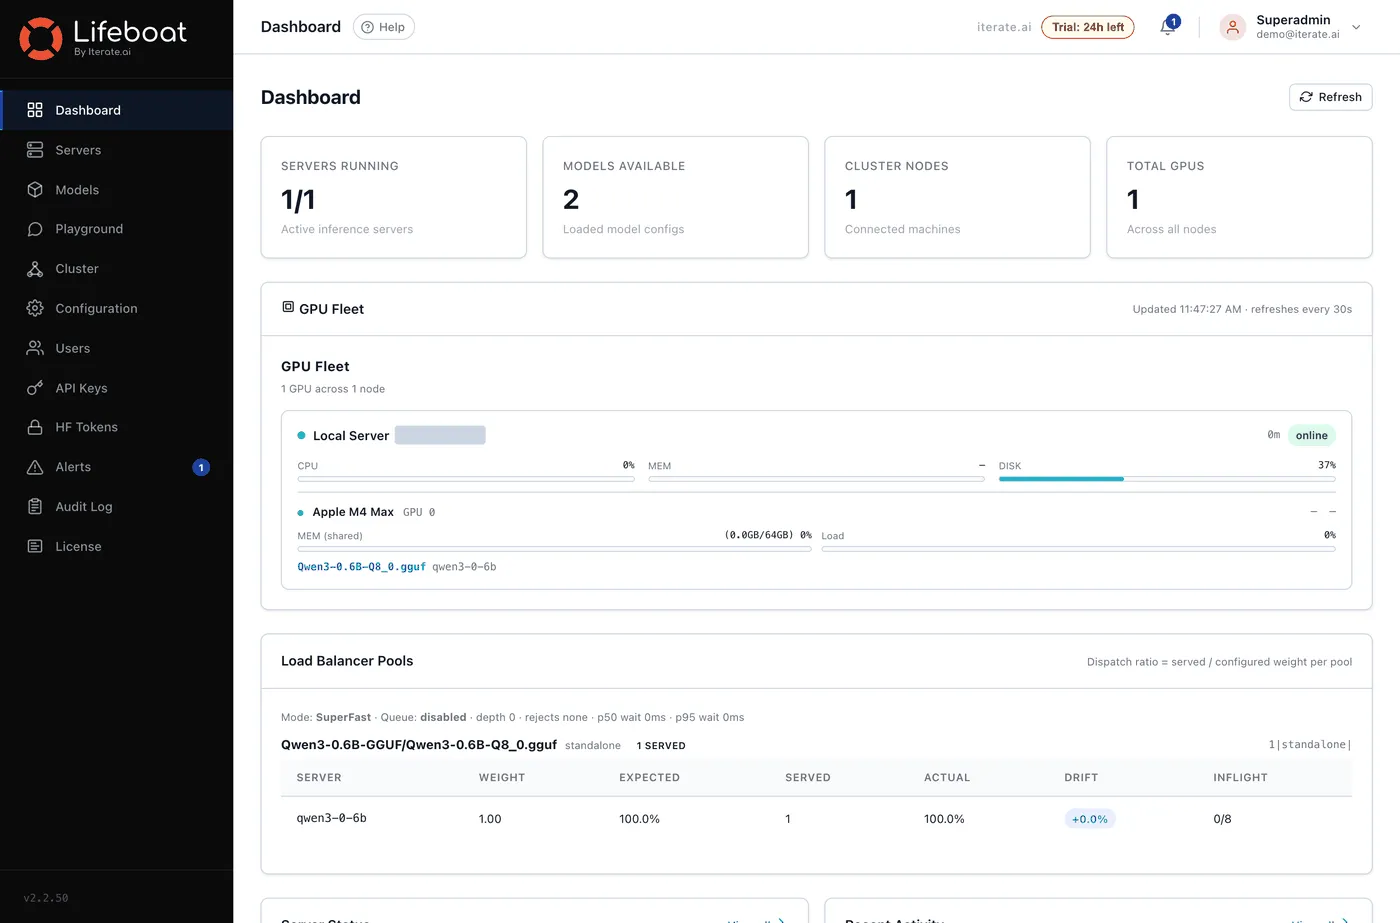
The GPU panel
Section titled “The GPU panel”Per GPU: name, memory used against total, utilisation and temperature. Across a fleet, every node’s GPUs.
This is the panel to read before blaming a server that will not start. The common cases:
- Memory used with no Lifeboat server running — something else holds VRAM: a previous engine that did not exit, or someone’s notebook. Lifeboat sizes servers against live free memory, so that memory is genuinely unavailable, not merely reported.
- Memory total shown as unavailable — expected on unified-memory hardware (Apple Silicon, NVIDIA GB10 and Grace-Hopper), where the GPU shares system memory rather than having its own. Lifeboat reads available system memory on those hosts instead.
- Utilisation near zero while requests are slow — the bottleneck is not compute. Look at time-to-first-token in the Playground and at queue wait in the load-balancer card.
The servers panel
Section titled “The servers panel”Each server’s status, model, port and GPUs. Statuses are covered in Servers; the short version is that starting can legitimately last minutes and error rows carry a classified reason.
The Load Balancer Pools card
Section titled “The Load Balancer Pools card”One row per pool, showing in-flight requests, dispatch counts and — the useful part — configured traffic share against actual, with a drift badge.
Drift beyond roughly 10% under steady load is a signal, not noise. A server that is erroring gets briefly benched, one at capacity is skipped, and one parked at weight 0 is drained. The card header also names the active routing mode, so “rejected at 4 requests” is immediately explicable rather than mysterious.
Text-to-speech appears here as a separate row, marked as not resident and not streaming. That is deliberate — it is a subprocess per request rather than a warm backend, and presenting it as a pool would misrepresent it.
The alerts bell
Section titled “The alerts bell”The badge counts open alerts and takes the colour of the most severe. Clicking it opens the Alerts page.
Critical — act now:
| Alert | Meaning |
|---|---|
node_offline |
A node stopped answering. Resolves itself when it returns. |
server_unreachable |
A server is marked running but does not answer. |
server_gave_up |
Restarts exhausted. It needs a human. |
server_deterministic_crash |
It fails the same way every time — a configuration problem, not bad luck. |
gpu_failure |
The GPU reported a fault. |
disk_full |
Out of disk. Downloads and logs stop working. |
proxy_pool_exhausted |
No backend could take a request. |
database_error |
The control plane’s own store failed. |
Warning — look soon:
high_vram_usage, high_cpu_or_ram, server_auto_restarted (it crashed and came back — fine once, a pattern if repeated), detokenizer_stall, lb_sin_bin_churn (a backend erroring repeatedly enough to be benched and returned), model_download_failed, cluster_member_down, disk_warning, server_start_rejected.
Info — a record, not a problem: server_started, server_stopped, cluster_created, cluster_edited, model_download_completed, user_logged_in, config_changed.
A single server_auto_restarted warning is the one most often dismissed too quickly. It means something crashed. Once, after a transient, that is the system working. Repeatedly, it is a server that cannot stay up and the log will say why.
The licence badge
Section titled “The licence badge”Hidden when licensed. During the 24-hour grace period it counts down; once grace has elapsed it turns red and reads licence required. Clicking it opens activation. Only starting a server is gated — the console keeps working, which is what makes the badge reachable. See Licensing.
The confidential-computing badge
Section titled “The confidential-computing badge”Hidden unless confidential computing is active on the host. Green when the GPU trusted environment is attested, amber when the mode is requested but not verified. Clicking it opens the License page, which states which half is missing. See Security and compliance.
Help on every page
Section titled “Help on every page”The Help link beside each page title opens the documentation for that page. It is the same set of pages as this site’s navigation.
First checks
Section titled “First checks”A request failed. Read X-Lifeboat-Reject-Reason on the response — it names the cause. Diagnosing a rejection.
A server will not start. The reason on the row is classified. Why a server will not start.
Everything is slow. Check the routing mode and per-server concurrency before the GPU. Superfast caps each server at 4 concurrent requests by design; that is excellent for latency and limits throughput.
The model list is shorter than expected. The recommended catalogue is filtered to formats this machine can serve. Model management.
Sources and references
Section titled “Sources and references”- Fleet and routing: Clusters and load balancing
- Server lifecycle: Servers and multi-GPU
- Common questions: Troubleshooting and FAQ